
| Catch up Here! |
|---|
| This Webinar took place 4 October. Catch up by viewing the recording or reading the slides. |
|
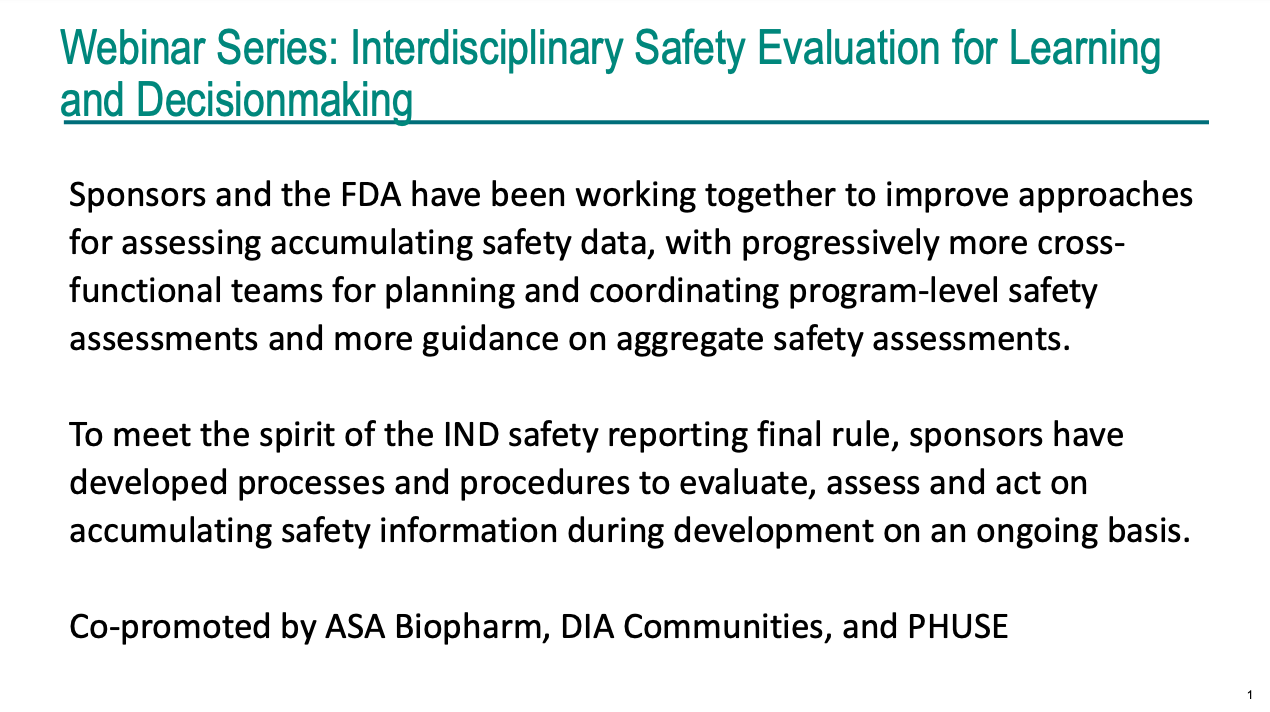
Webinar 4: Overall Safety Assessment – Interactive Safety Graphics for Regulatory Decision-Making | ||||||||||||||||||||||
|---|---|---|---|---|---|---|---|---|---|---|---|---|---|---|---|---|---|---|---|---|---|---|
Summary: This webinar examined the use of graphical approaches to evaluate clinical trial safety data, with an emphasis on new developments in interactive graphical approaches. Mat Soukup (FDA) discussed past efforts to move from tabular summaries and line listings of safety data to graphic representations – efforts made possible through a collaboration of academia, industry, and regulatory parties and hosted on CTSpedia. Steve Mallett (Veramed) summarised some of the unique challenges in safety data analysis, highlighting how standards and tools for visualising safety data have evolved in recent years, and discussed future trends with a focus on collaboration across industry, regulators and academia. Jeremy Wildfire (Gilead) presented on his experience developing the safetyGraphics R package, a collaboration involving members from over 15 organisations, including pharmaceutical companies, academia and the FDA. Finally, the panel discussed next steps for making open-source tools a standard part of the clinical trial workflow. The audience also asked the following questions during the webinar:
|
| Presenter | Bio |
|---|---|
| Jeremy Wildfire, GileadJeremy Wildfire is a data scientist at Gilead and is focused on creating modern tools that improve the analysis pipeline for clinical trials. Jeremy has served as the technical lead for the Interactive Safety Graphics (ISG) sub-team of the ASA Biopharm-DIA Safety Working Group since 2018. The working group is an interdisciplinary effort that seeks to provide a clinical safety workflow for monitoring during clinical development in an open-source model. The ISG team created a workflow to monitor hepatoxicity using the safetyGraphics R package and a well-documented based on the safety clinician’s monitoring practice. The working group has recently expanded its focus to include additional safety domains such as adverse events, QT and nephrotoxicity. |
| Steve Mallett, VeramedSteve Mallett has over 25 years’ experience working in the pharmaceutical industry as a statistical programmer and statistician. He has supported many medicine development projects, from early phase through to medical affairs. Steve recently joined Veramed as a senior manager and is also an active member of the PSI special interest group for data visualisation. |
| Mat Soukup, FDA/CDERMat Soukup received his PhD in Biostatistics from the University of Virginia in 2004 and joined the FDA/CDER as a statistical reviewer shortly thereafter. In 2010, he joined the Division of Biometrics VII as Team Lead and now serves as Deputy Division Director. In these roles, Mat has contributed and promoted appropriate statistical methodologies for the quantitative assessment of safety across a broad spectrum of topics such as meta-analysis, causal inference, signal detection, statistical graphics, and design of safety outcome trials. |


| In Partnership With | |||
|---|---|---|---|
| |||